How to plot data from ntp with gnuplot
Generate some simple data
with a script
./ntplog.sh > /tmp/ntp.log
#!/bin/bash
while true
do
echo -n `date +%s`
ntpq -p 127.0.0.1 | grep PPS | awk '{print ","$8","$9","$10}'
sleep 20
done
convert the comma with
tr ',' ' '
1623875394 0.000 +0.014 0.008
1623875415 0.000 +0.009 0.008
1623875436 0.000 +0.014 0.008
1623875457 0.000 +0.012 0.008
1623875478 0.000 +0.008 0.008
1623875499 0.000 +0.009 0.008
1623875520 0.000 +0.008 0.008
1623875542 0.000 +0.008 0.008
1623875563 0.000 +0.009 0.008
1623875584 0.000 +0.007 0.008
1623875605 0.000 +0.007 0.008
1623875626 0.000 +0.009 0.008
1623875647 0.000 +0.008 0.008
1623875668 0.000 +0.007 0.008
1623875689 0.000 +0.006 0.008
plot with gnuplot
set terminal png size 1500,1000
set output 'test.png'
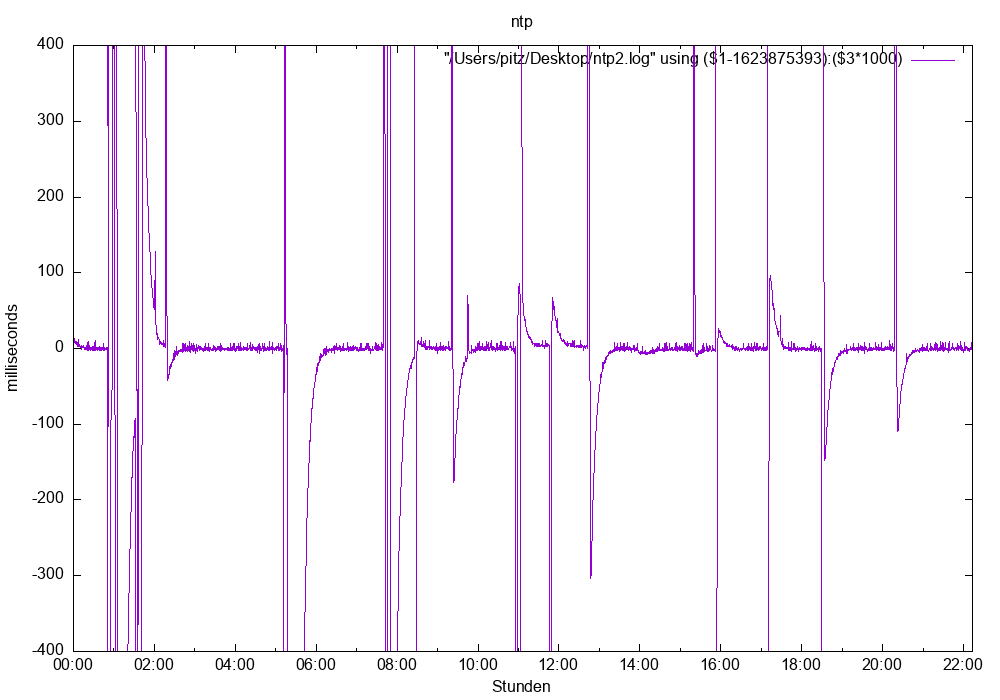
set title 'ntp'
set xdata time
set style data lines
#set term png
set timefmt "%Y-%m-%d %H:%M:%S"
set format x "%H:%M"
set xlabel "Stunden"
set ylabel "milliseconds"
#plot the graphic
set xrange [0:80000]
set yrange [-400:400]
plot "/Users/pitz/Desktop/ntp2.log" using ($1-1623875393):($3*1000)
gnuplot test.gp